How do I use search and filtering

Search and filtering are available in one easy-to-use search box. Switch between “Resolved” and “Unresolved” errors, search, and filter all in one place.
Search Input

Start typing in the search box and see your results update in real-time. The input at the top of your error list supports text searches for:
- Error type
- Error message
- Filename
- Environment
Advanced Filtering

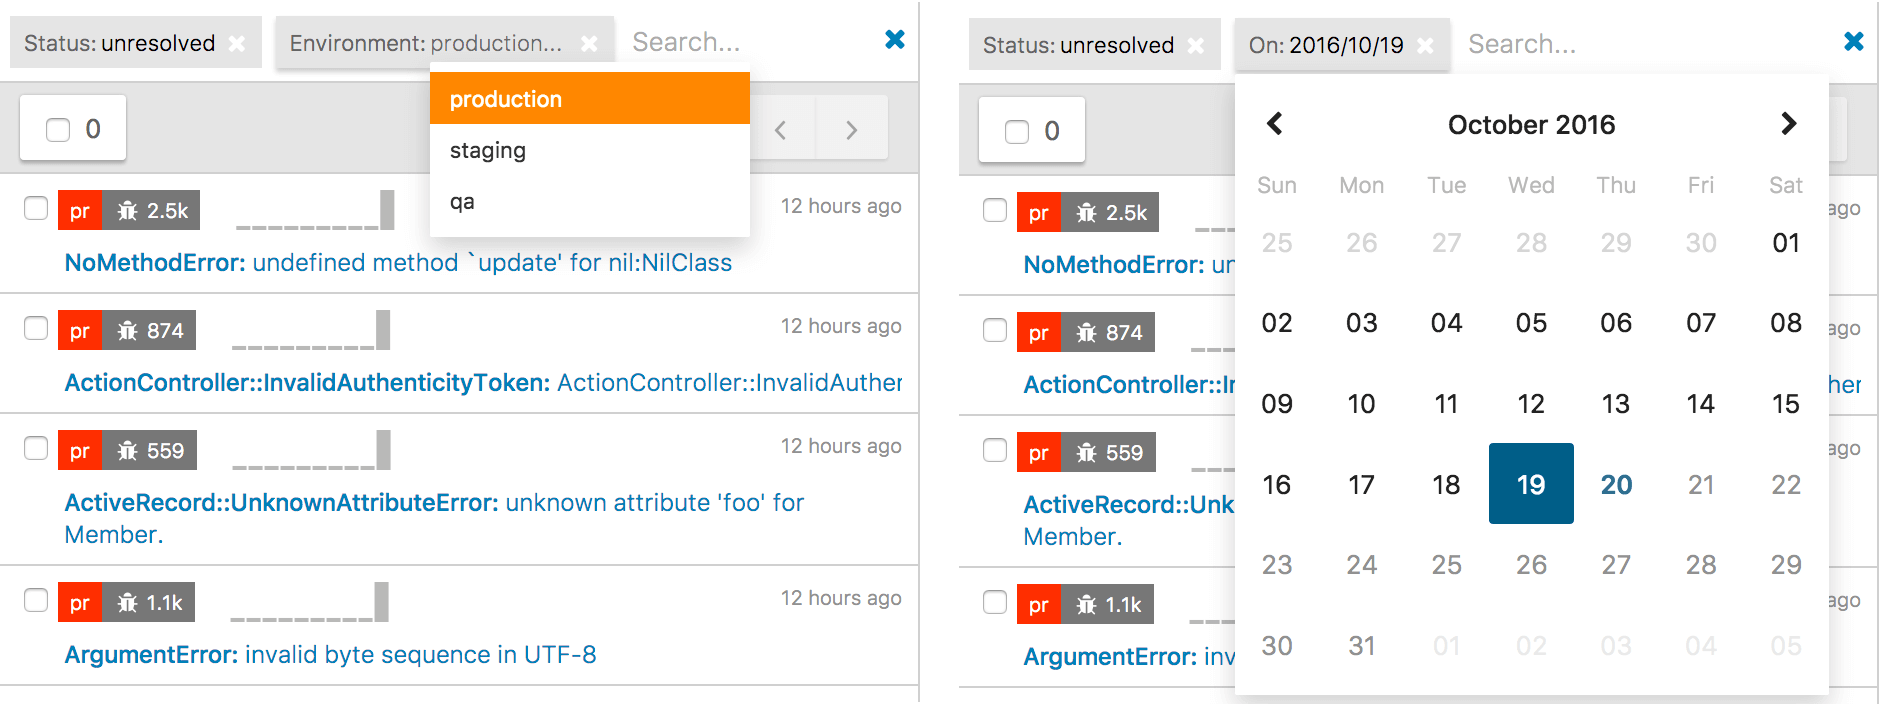
Advanced filtering options allow for further narrowing of results. These options are shown as suggestions beneath the search input and will autocomplete as you type.
This feature is available on all current plans.
- Action: The controller method the error occurred in
- After: Shows all occurrences that occurred after a specific date
- Before: Shows all occurrences that occurred before a specific date
- Browser engine: The engine the browser is built on
- Browser platform: OS the browser is running on
- Browser version: Version of the browser
- Component: The controller the error occurred in
- Deploy: Set up using Deployment Tracking
- Environment: e.g. Production, Staging, QA, etc.
- File: The file associated with the error
- Function: The function where the error occurred
- Has comments: Are comments added to the error in Airbrake
- Hostname: The hostname associated with the error
- HTTP method: Shows errors with a specific HTTP method (DELETE, GET, POST, etc)
- Message: Searches message associated with the error
- Message param: Searches parameters associated with the message
- Muted: Shows all muted/unmuted errors
- On: Shows all groups with last occurrence on a specific date
- RemoteAddr: The remote address where the error occurred
- Remote country: The location of the app server
- Severity: Shows the severity associated with the error
- URL: Shows URL that produced the error
- User: The user that was signed in when the error occurred
- User address: The IP address associated with the user
- User country: The country associated with the IP address
- Version: Search by the app version
Note: You’ll only see an option to filter if you are sending the data. E.g. If you don’t have Deployment Tracking set up, you won’t see the filter by deploy option.
Filtering by Custom Attributes
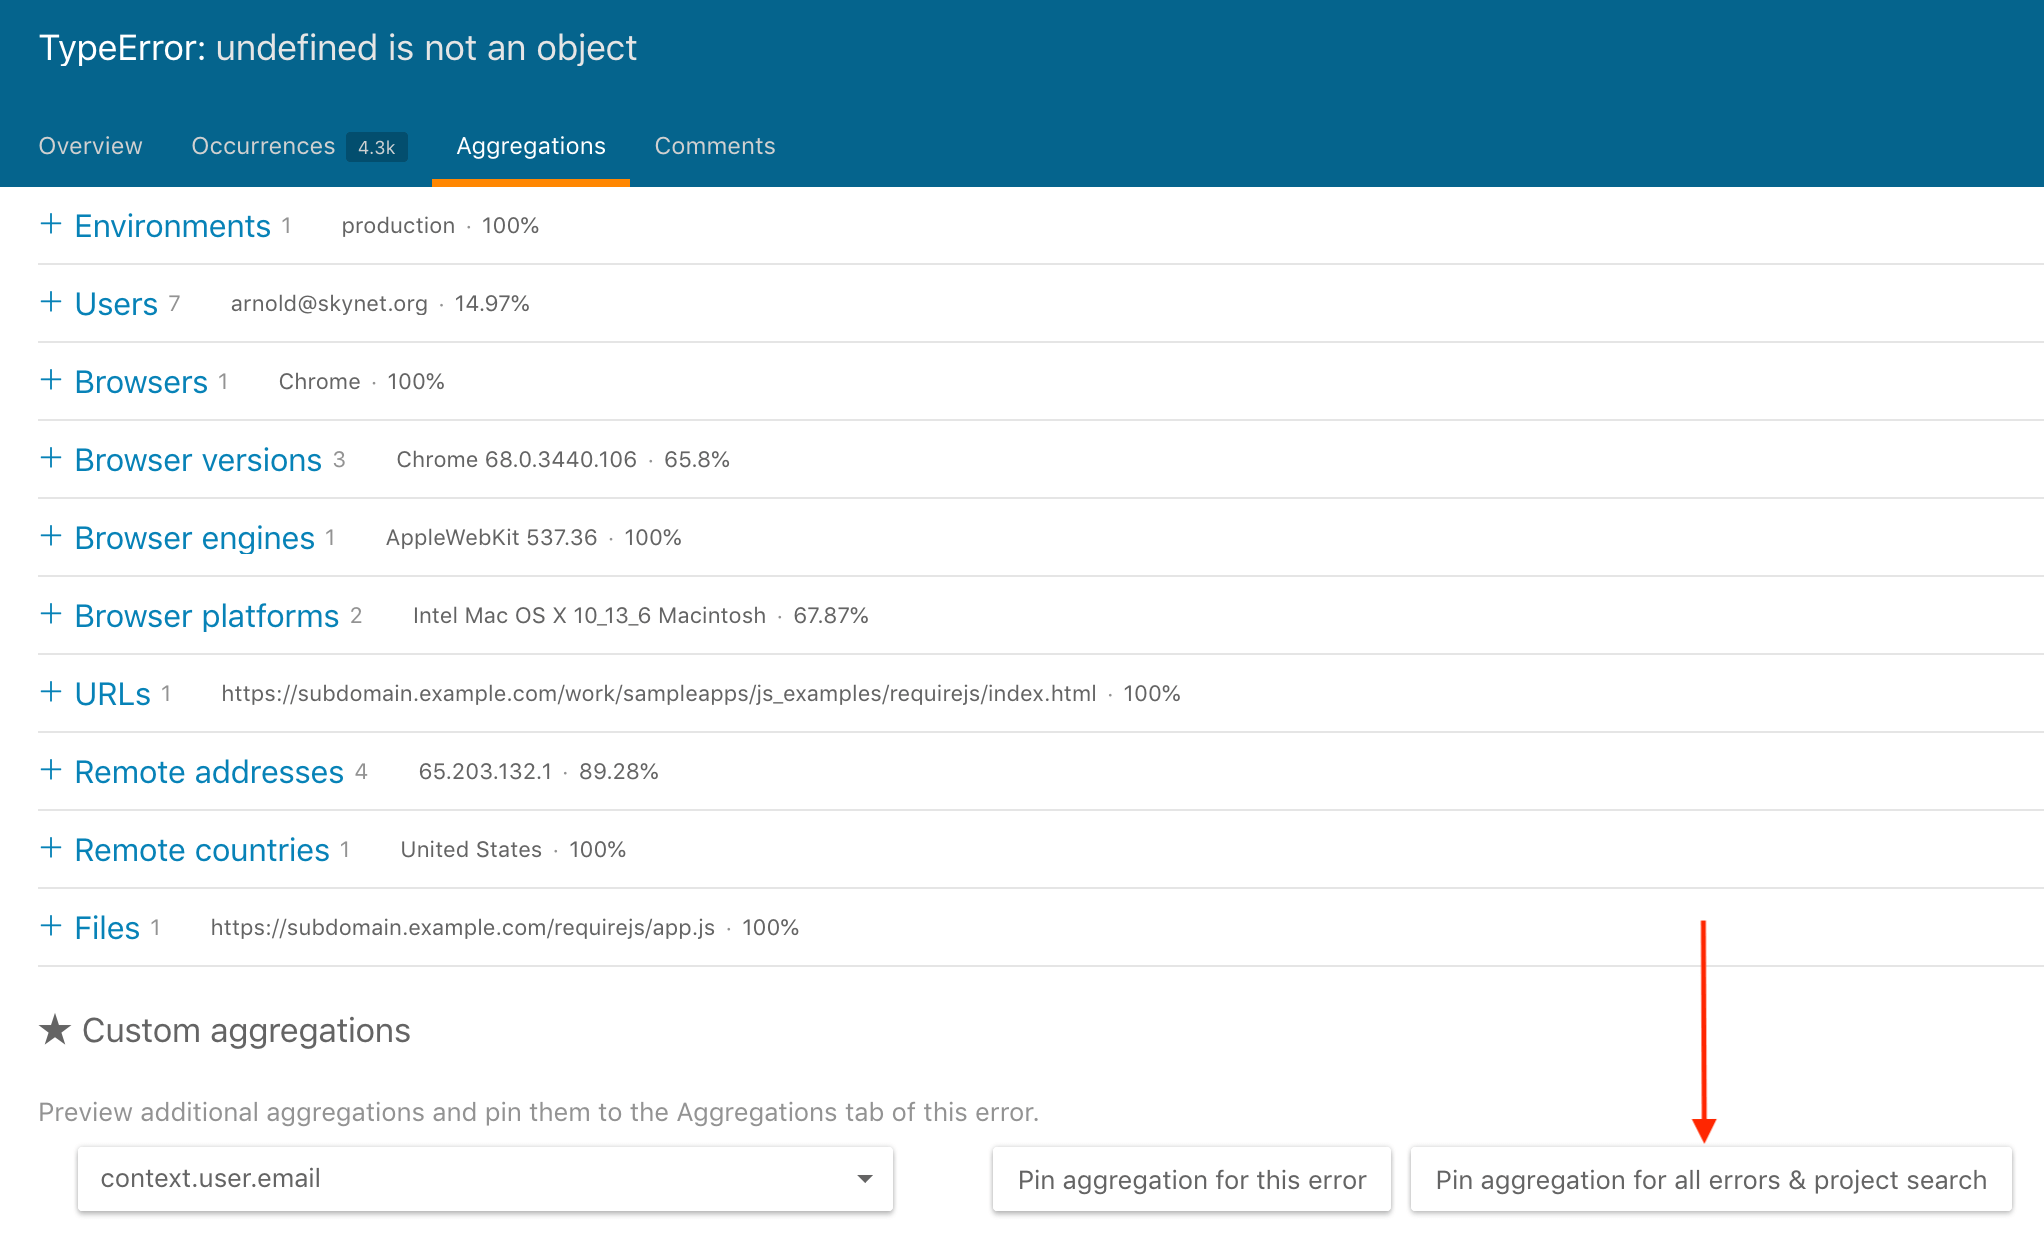
To filter by additional attributes not present in the standard options, first visit the “Aggregations” tab for one of your errors. Next, select an attribute from the “Custom aggregations” dropdown. Finally, click the “Pin aggregation for all errors & project search” button to enable search capabilities on this attribute.
This feature is available on all current plans.

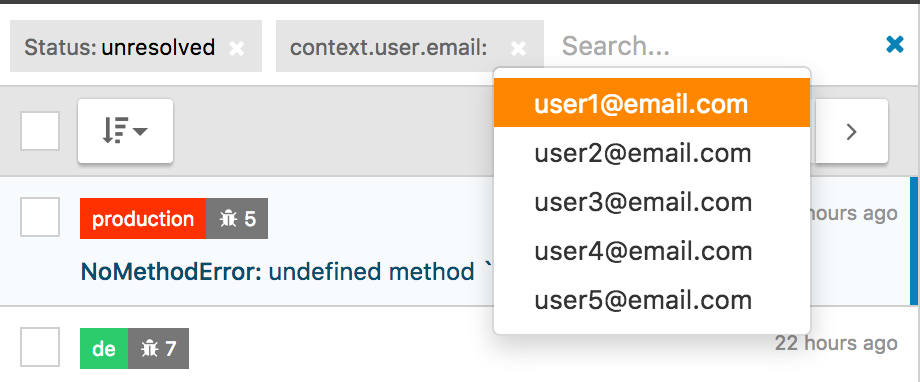
After the custom aggregation has been processed, you will be able to filter errors based on this attribute.

Sort by options

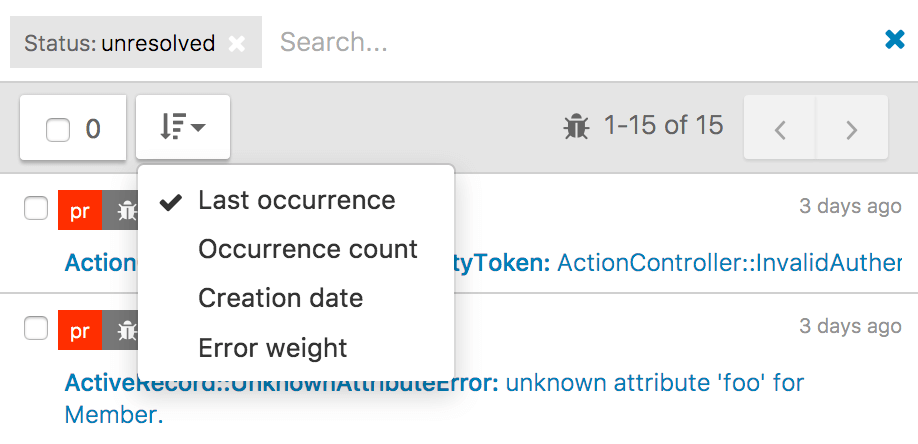
Sort by options include:
- Last occurrence: Sorts by most recent notice
- Occurrence count: Sorts by the number of notices in an error group
- Creation date: Sorts by error group creation date
- Error Weight: Sorts by recent error impact based on traffic distribution and density
- Error Severity: Sorts by severity of the error from highest to lowest severity