Aggregations
What are Aggregations?

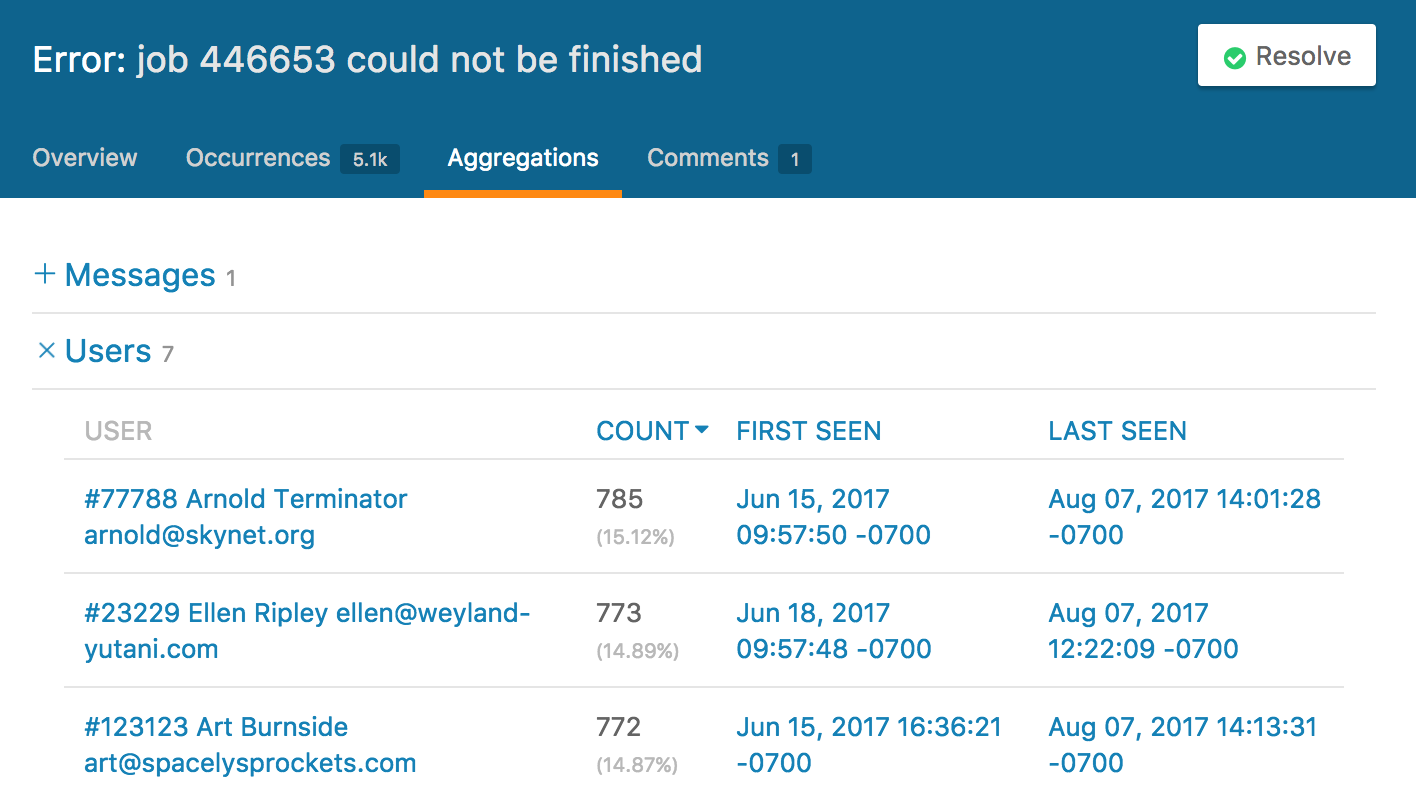
Aggregations show you all sorts of useful info across all the occurrences of an error group. If the data is present, Airbrake will automatically show you a breakdown of these segments of each error group:
- Error messages
- Server hostnames
- Remote addresses and countries
- Components and actions
- Affected users, user IP addresses, IP countries
- Browsers, browser engines, and browser platforms
- Filenames
- Functions
- App versions
- URLs
You can view an error’s Aggregations by clicking the “Aggregations” tab to the right of the “Occurrences” tab. Note: the Aggregations tab is only available when there’s more than one occurrence of an error.
This feature is available on all current plans.
Custom Aggregations
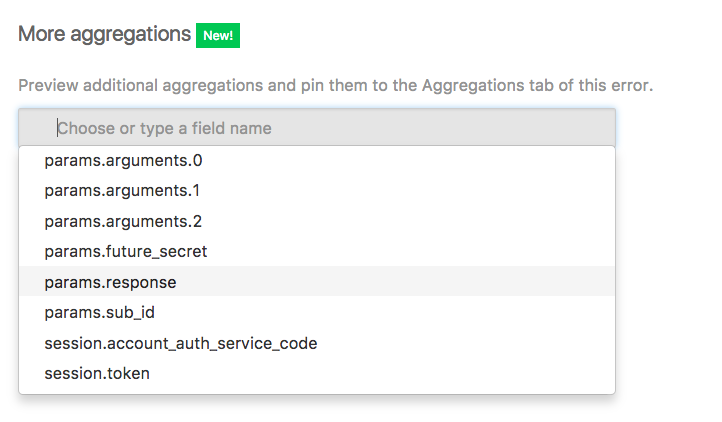
Along with the automatic Aggregations Airbrake makes for you, you can add any error parameter to be aggregated. To do this, just select the parameter you want from the drop down menu in the “More aggregations” section of the Aggregations tab.
This feature is available on all current plans.
Select a custom aggregation

Add a custom aggregation to project wide search
Adding an aggregation to project wide search means that you can now search and filter all errors in your project by this parameter. For more information on this, please visit our Search and Filtering doc.