Performance Monitoring
On this page
- Introduction
- Key features
- Install, config, upgrade
- Monitoring Rails apps
- Monitoring Node.js apps
- Monitoring Go apps
- Monitoring Python apps
- Monitoring Java apps
- Updating from airbrake-js for Node.js projects
- Updating from node-airbrake for Node.js projects
- Updating from older Python notifiers
- Updating your Go notifier
- Updating your Python notifier
- Updating your Java notifier
Introduction
Application Performance Monitoring with Airbrake makes it easy to:
- Understand high-level performance: Quickly see a broad performance overview for your whole application.
- Monitor user satisfaction: Measure user satisfaction with your app performance using Apdex.
- Catch problem routes: Identify routes with slow or error-prone performance.
- Analyze granular performance metrics: Zoom into specific endpoints to see time spent in the DB, view, cache, external requests, and more.
- Dive into database performance: Analyze SQL database queries being called and how long they take.
- Track your background jobs: Monitor background job performance, track job failures and durations.
Select your language
To start monitoring performance for your app, select a guide:
Key features
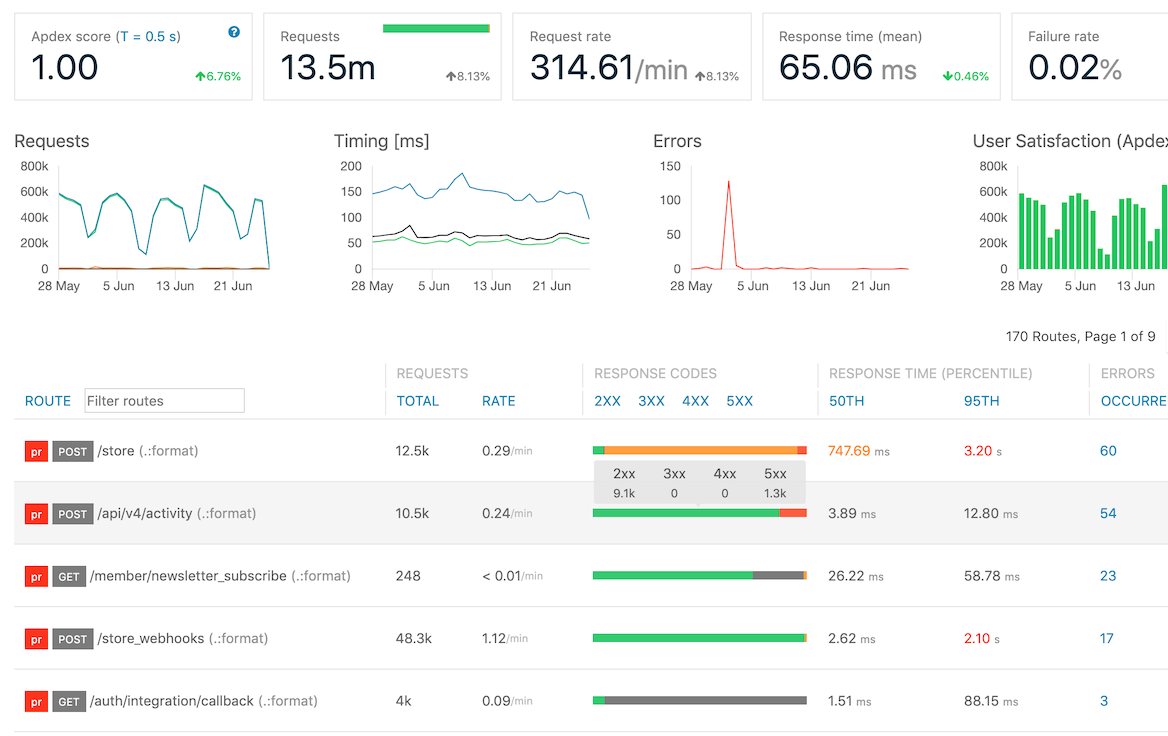
View all of your app’s performance stats at a glance. Trend cards highlight key performance metrics across your whole app. The charts show requests, response times, errors, and user satisfaction (Apdex) over time. The routes list exposes performance stats per route, making it easy to pinpoint and resolve issues.

Detailed route performance
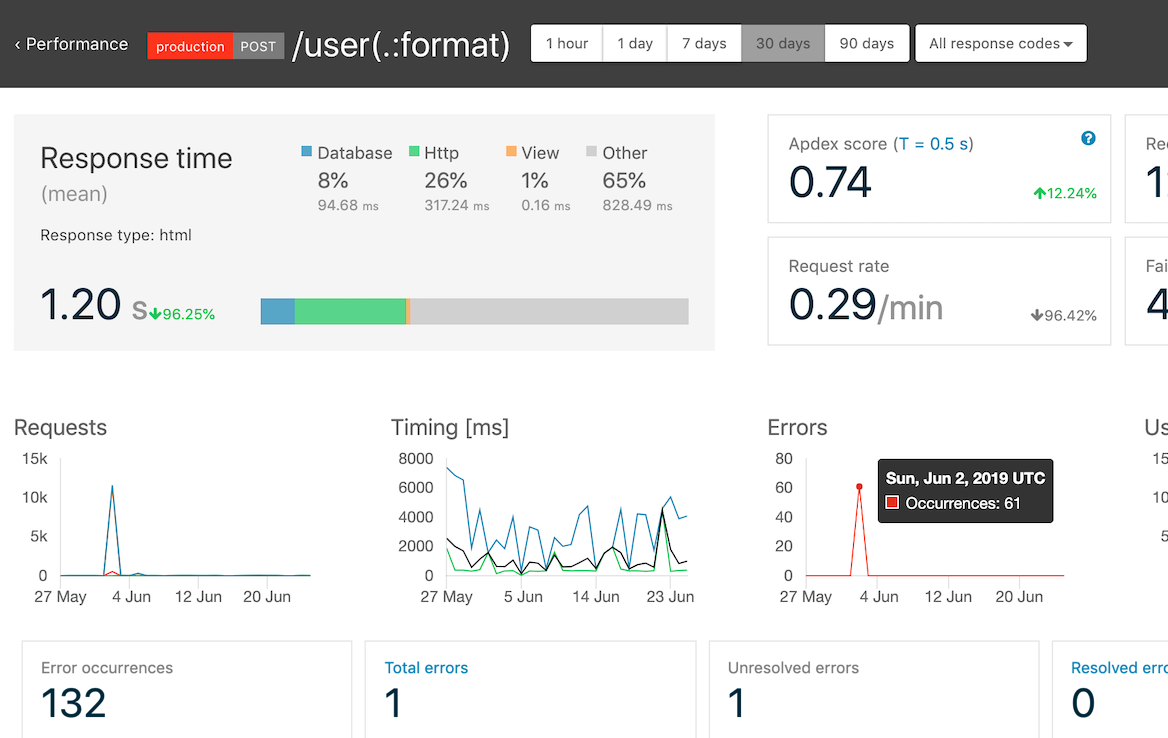
Diving deeper into an individual route, you can see the proportion of time spent in the database, cache, views, or making external requests. There are similar trend cards and performance charts to quickly understand the route performance. You can also click through from a route to its linked Airbrake errors.

Background job monitoring
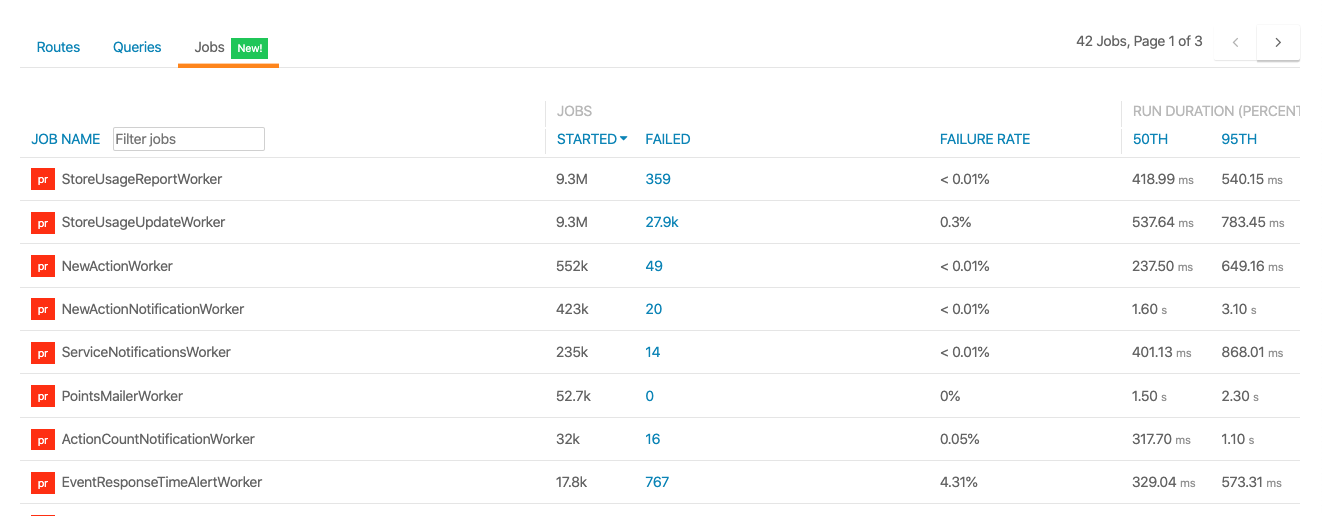
Automatically track background job performance for all your apps. Measure and improve the quality of your background jobs and easily gain insight into job failure rates and duration issues. You can find your app’s job performance from the jobs tab of the performance dashboard.

Supported Background Job libraries
- Ruby supports automatic job tracking for
- Sidekiq, Resque, Sneakers, DelayedJob, ActiveJob, and Shoryuken
- Python supports automatic job tracking for Celery with minimal setup.
- Go supports Manual background job tracking
- Java supports Manual background job tracking
- Don’t see your library? Let us know support@airbrake.io!
Install, config, upgrade
Monitoring Rails apps
Performance Monitoring is built into the same notifier you use to report errors from your application. To start sending performance data for your app to Airbrake just install or upgrade the Airbrake gem to the latest version.
Step 1: Install the latest version of the Airbrake gem
Add the Airbrake gem to your Gemfile:
gem 'airbrake'
To integrate Airbrake with your Rails application, you need to know your
project id and project
key. Set
AIRBRAKE_PROJECT_ID & AIRBRAKE_PROJECT_KEY environment variables with your
project’s values and generate the Airbrake config:
export AIRBRAKE_PROJECT_ID=<PROJECT ID>
export AIRBRAKE_PROJECT_KEY=<PROJECT KEY>

rails g airbrake
Step 2: Update your config file
Check your config/initializers/airbrake.rb file to make sure the
performance_stats options is set to true.
Airbrake.configure do |c|
  c.performance_stats = true
end
Congratulations!
Great job! If you’ve used this example in your app, you can visit your Airbrake project’s Performance Dashboard to see your performance data! Soon enough you’ll have more insights into your application’s performance. In the meantime why not check out the Performance Dashboard features. Have questions about Performance Monitoring? Check out our Performance Monitoring FAQ for more information.Upgrading from a previous gem version?
If you are upgrading from a previous version of our gem, please follow our upgrade guide to get started with Performance Monitoring.
Monitoring Node.js apps
Get the most out of Airbrake’s features and stay up to date with the latest improvements by updating your project to the latest version of our Node.js error reporting library.
Name change note
Our JavaScript library’s name has recently changed from airbrake-js to
@airbrake/node (for Node.js apps). If you are using airbrake-js check out
our upgrade doc.
If you are on the deprecated node-airbrake notifier, please
visit our other upgrade guide.
Update your notifier
If you’re using our official notifier, all you need to do is update the version you’re using:
npm update @airbrake/node
Or, if you’re using yarn:
yarn upgrade @airbrake/node
Performance Monitoring for Express.js apps
To get started, install our Express.js middleware as shown in the install guide. Performance Monitoring is completely automatic after installation - no extra setup required.
Congratulations!
Great job! If you’ve used this example in your app, you can visit your Airbrake project’s Performance Dashboard to see your performance data! Soon enough you’ll have more insights into your application’s performance. In the meantime why not check out the Performance Dashboard features. Have questions about Performance Monitoring? Check out our Performance Monitoring FAQ for more information.Monitoring Go apps
Go Support
Airbrake Performance Monitoring for Go supports:
- Sending route stats
- HTTP middlewares
- Wrapping important code blocks for detailed timing
- Collecting stats about individual SQL queries
Step 1: Install the latest version of gobrake
go get github.com/airbrake/gobrake/v5
Step 2: Configure gobrake and start sending route stats
Before you can send performance stats replace the placeholder ProjectId and
ProjectKey values from the example below with the real values from your
project’s setting page.
Now that your gobrake notifier is configured let’s collect some routes stats, we will use a simple net/http middleware in this example.
Note: gobrake provides middleware out of the box and you may find our example apps more helpful:
package main

import (
  "fmt"
  "net/http"

  "github.com/airbrake/gobrake/v5"
)

// Airbrake is used to report errors and track performance
var Airbrake = gobrake.NewNotifierWithOptions(&gobrake.NotifierOptions{
  ProjectId: 123123,               // <-- Fill in this value
  ProjectKey: "YourProjectAPIKey", // <-- Fill in this value
  Environment: "Production",
})

func indexHandler(w http.ResponseWriter, req *http.Request) {
  fmt.Fprintf(w, "Hello, There!")
}

func main() {
  fmt.Println("Server listening at http://localhost:5555/")
  // Wrap the indexHandler with Airbrake Performance Monitoring middleware:
  http.HandleFunc(airbrakePerformance("/", indexHandler))
  http.ListenAndServe(":5555", nil)
}

func airbrakePerformance(route string, h http.HandlerFunc) (string, http.HandlerFunc) {
  handler := http.HandlerFunc(func(w http.ResponseWriter, req *http.Request) {
    ctx := req.Context()
    ctx, routeMetric := gobrake.NewRouteMetric(ctx, req.Method, route) // Starts the timing
    arw := newAirbrakeResponseWriter(w)

    h.ServeHTTP(arw, req)

    routeMetric.StatusCode = arw.statusCode
    Airbrake.Routes.Notify(ctx, routeMetric) // Stops the timing and reports
    fmt.Printf("code: %v, method: %v, route: %v\n", arw.statusCode, req.Method, route)
  })

  return route, handler
}

type airbrakeResponseWriter struct {
  http.ResponseWriter
  statusCode int
}

func newAirbrakeResponseWriter(w http.ResponseWriter) *airbrakeResponseWriter {
  // Returns 200 OK if WriteHeader isn't called
  return &airbrakeResponseWriter{w, http.StatusOK}
}

func (arw *airbrakeResponseWriter) WriteHeader(code int) {
  arw.statusCode = code
  arw.ResponseWriter.WriteHeader(code)
}
Once you run this example and perform some curls or visit
localhost:5555/ in your browser, you will see
performance requests in your project’s performance dashboard.
Congratulations!
Great job! If you’ve used this example in your app, you can visit your Airbrake project’s Performance Dashboard to see your performance data! Soon enough you’ll have more insights into your application’s performance. In the meantime why not check out the Performance Dashboard features. Have questions about Performance Monitoring? Check out our Performance Monitoring FAQ for more information.Measuring timing of specific operations
Need more visibility into a slow route? To get more detailed timing, you
can wrap important blocks of code into spans. For example, you can create 2
spans sql and http to measure timing of specific operations:
metric := &gobrake.RouteMetric{
    Method: c.Request.Method,
    Route: routeName,
    StartTime: time.Now(),
}

metric.StartSpan("sql")
users, err := fetchUser(ctx, userID)
metric.EndSpan("sql")

metric.StartSpan("http")
resp, err := http.Get("http://example.com/")
metric.EndSpan("http")

metric.StatusCode = http.StatusOK
notifier.Routes.Notify(ctx, metric)
Want to learn more?
Want to learn more about gobrake? Check out our official documentation.
Monitoring Python apps
Python Support
Airbrake Performance Monitoring for Python supports:
- Sending route stats
- HTTP middlewares
- Wrapping important code blocks for detailed timing
- Collecting stats about individual SQL queries
Note: Pybrake provides middleware out of the box, and you may find our example apps more helpful:
- AIOHTTP
- BottlePy
- Celery
- CherryPy
- Django
- Falcon
- FastAPI
- Flask
- Hug
- Masonite
- Morepath
- Pycnic
- Pyramid
- Sanic
- Starlette
- Tornado
- Turbogears
- Manual tracking via API (more info below)
Tracking Performance manually
Not using the Django or Flask frameworks? Track performance manually by using the following API:
Sending route stats
notifier.routes.notify allows sending route stats to Airbrake. The library
provides integrations with Django and Flask. (your routes are tracked
automatically). You can also use this API manually:
import pybrake.RouteMetric as RouteMetric

metric = RouteMetric(method=request.method, route=route)
metric.status_code = response.status_code
metric.content_type = response.headers.get("Content-Type")
metric.end_time = time.time()

notifier.routes.notify(metric)
Sending route breakdowns
notifier.routes.breakdowns.notify allows sending performance breakdown stats
to Airbrake. You can use this API manually:
import pybrake.RouteBreakdowns as RouteBreakdowns

metric = RouteBreakdowns(method=request.method, route=route)
metric.response_type = response.headers.get("Content-Type")
metric.end_time = time.time()

notifier.routes.notify(metric)
Sending query stats
notifier.queries.notify allows sending SQL query stats to Airbrake. The
library provides integration with Django (your queries are tracked
automatically). You can also use this API manually:
import pybrake.QueryStat as QueryStat

metric = QueryStat(
  method=request.method,
  route=route,
  query="SELECT * FROM foos"
)
metric.end_time = time.time()

notifier.queries.notify(metric)
Sending queue stats
notifier.queues.notify allows sending queue (job) stats to Airbrake. The
library provides integration with Celery (your queues are tracked
automatically). You can also use this API manually:
import pybrake.QueueMetric as QueueMetric

metric = QueryMetric(queue="foo_queue")
notifier.queues.notify(metric)
Congratulations!
Great job! If you’ve used this example in your app, you can visit your Airbrake project’s Performance Dashboard to see your performance data! Soon enough you’ll have more insights into your application’s performance. In the meantime why not check out the Performance Dashboard features. Have questions about Performance Monitoring? Check out our Performance Monitoring FAQ for more information.Want to learn more?
Want to learn more about pybrake? Check out our official GitHub repo.
Monitoring Java apps
Java Support
Airbrake Performance Monitoring for Java supports:
- Sending route stats
- HTTP middlewares
- Wrapping important code blocks for detailed timing
- Collecting stats about individual SQL queries
Note: Support for Middleware’s to be added soon. Manual tracking via API (more info below)
Tracking Performance manually
Track performance manually by using the following API:
Sending route stats
notifier.routes.notify allows sending route stats to Airbrake. You can also use this API manually:
import io.airbrake.javabrake.RouteMetric;

RouteMetric metric = new RouteMetric(request.getMethod(), request.getRequestURI());

metric.statusCode = response.getStatus();
metric.contentType = response.getContentType();
metric.endTime = new Date();

notifier.routes.notify(metric);
Sending route breakdowns
notifier.routes.notify allows sending performance breakdown stats
to Airbrake. You can use this API manually:
import io.airbrake.javabrake.RouteMetric;

RouteMetric metric = new RouteMetric(
    request.getMethod(),
    request.getRequestURI()
);

metric.startSpan("span1 name", new Date());
try {
  do();
} catch (Exception e) {
  e.printStackTrace();
}
metric.endSpan("span1 name", new Date());

metric.startSpan("span2 name", new Date());
try {
  do();
} catch (Exception e) {
  e.printStackTrace();
}
metric.endSpan("span2 name", new Date());
metric.end();

metric.statusCode = response.getStatus();
metric.contentType = response.getContentType();

notifier.routes.notify(metric);
Sending query stats
notifier.queries.notify allows sending SQL query stats to Airbrake. You can also use this API manually:
Date startTime = new Date();
try {
  do();
} catch(Exception e) {
  e.printStackTrace();
}
Date endTime = new Date();

notifier.queries.notify(
    request.getMethod(),
    request.getRequestURI(),
    "SELECT * FROM foos",
    startTime,
    endTime
);
Sending queue stats
notifier.queues.notify allows sending queue (job) stats to Airbrake. You can also use this API manually:
import io.airbrake.javabrake.QueueMetric;

QueueMetric metric = new QueueMetric("foo_queue");

metric.startSpan("span1 name", new Date());
try {
  do();
} catch (Exception e) {
  e.printStackTrace();
}
metric.endSpan("span1 name", new Date());

metric.startSpan("span2 name", new Date());
try {
  do();
} catch (Exception e) {
  e.printStackTrace();
}
metric.endSpan("span2 name", new Date());
metric.end();

notifier.queues.notify(metric);
Congratulations!
Great job! If you’ve used this example in your app, you can visit your Airbrake project’s Performance Dashboard to see your performance data! Soon enough you’ll have more insights into your application’s performance. In the meantime why not check out the Performance Dashboard features. Have questions about Performance Monitoring? Check out our Performance Monitoring FAQ for more information.Want to learn more?
Want to learn more about javabrake? Check out our official GitHub repo.
Updating from airbrake-js for Node.js projects
Name change note
Our JavaScript library’s name has recently changed from airbrake-js to
@airbrake/node (for Node.js apps). If you are using airbrake-js, we would
recommend following this guide to update to the latest version of our
JavaScript library.
Step 1: Uninstall airbrake-js
Uninstall the old package:
npm uninstall airbrake-js
Step 2: Install @airbrake/node
Install the new package with npm:
npm install @airbrake/node
We also support installation via Yarn.
Step 3: Replace mentions with new library
Note: Express.js users should follow our Express.js install guide.
Imports: Replace old library import:
var AirbrakeClient = require('airbrake-js');
With new package name:
var Airbrake = require('@airbrake/node');
Class names:
Replace configuration snippet instantiation with new name:
Change AirbrakeClient() to new name: Airbrake.Notifier() in your
configuration snippet:
var airbrake = new Airbrake.Notifier({
  // project credentials are set here...
});
Find advanced configuration options and examples on our official GitHub repo.
Updating from node-airbrake for Node.js projects
Library note
This update guide is for projects on
node-airbrake. For projects on
airbrake-js, please visit our other
guide. For
projects on @airbrake/node,
please visit our other guide.
Step 1: Uninstall airbrake
Uninstall the old package:
npm uninstall airbrake
Step 2: Install @airbrake/node
Install the new package with npm:
npm install @airbrake/node
We also support installation via Yarn.
Step 3: Replace mentions with new library
Note: Express.js users should follow our Express.js install guide.
Replace old configuration snippet instantiation:
var airbrake = require('airbrake').createClient(
  '123987',       // Project ID
  'abcdefg123456' // Project key
);
airbrake.handleExceptions();
With new package format:
var Airbrake = require('@airbrake/node');

var airbrake = new Airbrake.Notifier({
  projectId: '123987',
  projectKey: 'abcdefg123456',
});
Find advanced configuration options and examples on our official GitHub repo.
Updating from older Python notifiers
Get the most out of Airbrake’s features and stay up to date with the latest improvements by updating your project to the latest version of our Python error reporting library for Django and Flask.
If you are using Python 3.4+, we would recommend upgrading the Airbrake
library you use from
airbrake-python to our new
official notifier: pybrake.
Step 1: uninstall airbrake-python
pip uninstall airbrake
Step 2: remove references to the old notifier
Remove references to airbrake like imports:
import airbrake

logger = airbrake.getLogger(api_key=*****, project_id=123)
Step 3: install new notifier
pip install -U pybrake
Configuration
To configure pybrake you will need your Airbrake project’s id and api_key,
these are available from your project’s settings page.
import pybrake

notifier = pybrake.Notifier(project_id=123,
                            project_key='FIXME',
                            environment='production')
Sending errors to Airbrake
try:
    raise ValueError('hello')
except Exception as err:
    notifier.notify(err)
Updating your Go notifier
Get the most out of Airbrake’s features and stay up to date with the latest improvements by updating your project to the latest version of our Go error reporting library.
To update gobrake, run the following command:
go get -u github.com/airbrake/gobrake/v5
Updating your Python notifier
Get the most out of Airbrake’s features and stay up to date with the latest improvements by updating your project to the latest version of our Python error reporting library for Django and Flask.
To update your notifier, run this command:
pip install --upgrade pybrake
Haven’t installed Pybrake yet? Check out our installation guide for your framework:
- AIOHTTP
- BottlePy
- Celery
- CherryPy
- Django
- Falcon
- FastAPI
- Flask
- Hug
- Masonite
- Pycnic
- Pyramid
- Sanic
- Starlette
- Tornado
- Turbogears
Updating your Java notifier
Get the most out of Airbrake’s features and stay up to date with the latest improvements by updating your project to the latest version of our Java error reporting library.
To update javabrake, enter the ‘javabrake version’ you want and build your project.
Gradle
implementation 'io.airbrake:javabrake:javabrake version'
Maven
<dependency>
  <groupId>io.airbrake</groupId>
  <artifactId>javabrake</artifactId>
  <version>javabrake version</version>
</dependency>
Ivy
<dependency org='io.airbrake' name='javabrake' rev='javabrake version'>
  <artifact name='javabrake' ext='pom'></artifact>
</dependency>